E.ON Energy Solutions EcoMeter Manuale utente
Helping our customers.
We’re on it.
“Smart meters have changed the
way we use energy – and they’re
helping us save money too.”
Your smart energy display user guide will help you get
to grips with your new smart meter and make the most
of those savings right away.
This handy guide will
help you use your smart
energy display to keep
an eye on how much
energy you’re using.
Inside, you’ll also find
out how your display
could help you save
energy and money.
3 What does my Smart energy
display do?
4 How do I get up and running?
6 Your quick start guide
8 Using your smart energy display
9 Energy costs
10 Usage
11 CO2 emissions
12 Setting the alarm
13 Setting the key tone and
light options
14 What else do I need to know?
15 What happens next?
Contents
2
This guide is for our customers
who have electricity or gas smart
meters installed or both by E.ON.

How does smart metering work?
Smart meters are intelligent electricity
and gas meters that enable two-way
communications between your home
and us. Your meter will talk to us
remotely, sending us accurate meter
readings and energy usage details. It’ll
also talk to you through your display – a
unit that can sit anywhere in your home.
It communicates remotely with your
smart meters to show you exactly
how much electricity and gas you’re
using. You can look at this information in
real time or by looking back at the last
week, month or year.
Your display collects energy usage information and displays it on a
screen, it also provides a guide of what it’s costing you. Furthermore, you
can see how much carbon dioxide (CO2) your home is producing. All this
at the push of a button!
So what does my new
smart energy display do?
What are the benefits?
Smart metering technology gives
automatic meter readings, which means:
• you won’t need to read your meter
and we’ll only come to check it
every two years
• There’ll be no more estimated
bills unless you move plan or
there’s been a price change.
You’ll see a guide to your energy costs,
and usage in real time, which means:
• you can spot where you could
make savings
• you can find ways to make your
home more energy efficient.
It talks to us... ...it talks to you
Your smart meter
E.ON
customer
service
Your smart
energy display
How can my display help me save energy and money?
Your display stores a guide to your energy costs and usage
information so you can view it for the last week, month or year, as
well as in real time. By tracking your costs and usage, you’ll build a
picture of when and where you use the most energy in your home.
In time, you’ll be able to see where you could use less energy
and cut your bills.
It’s quick and easy to start using your smart energy display
to monitor your energy costs and usage. Our smart meter
installer will have set up your display and linked it to your
smart meter, so you’re ready to go.
4
How do I get up and
running?
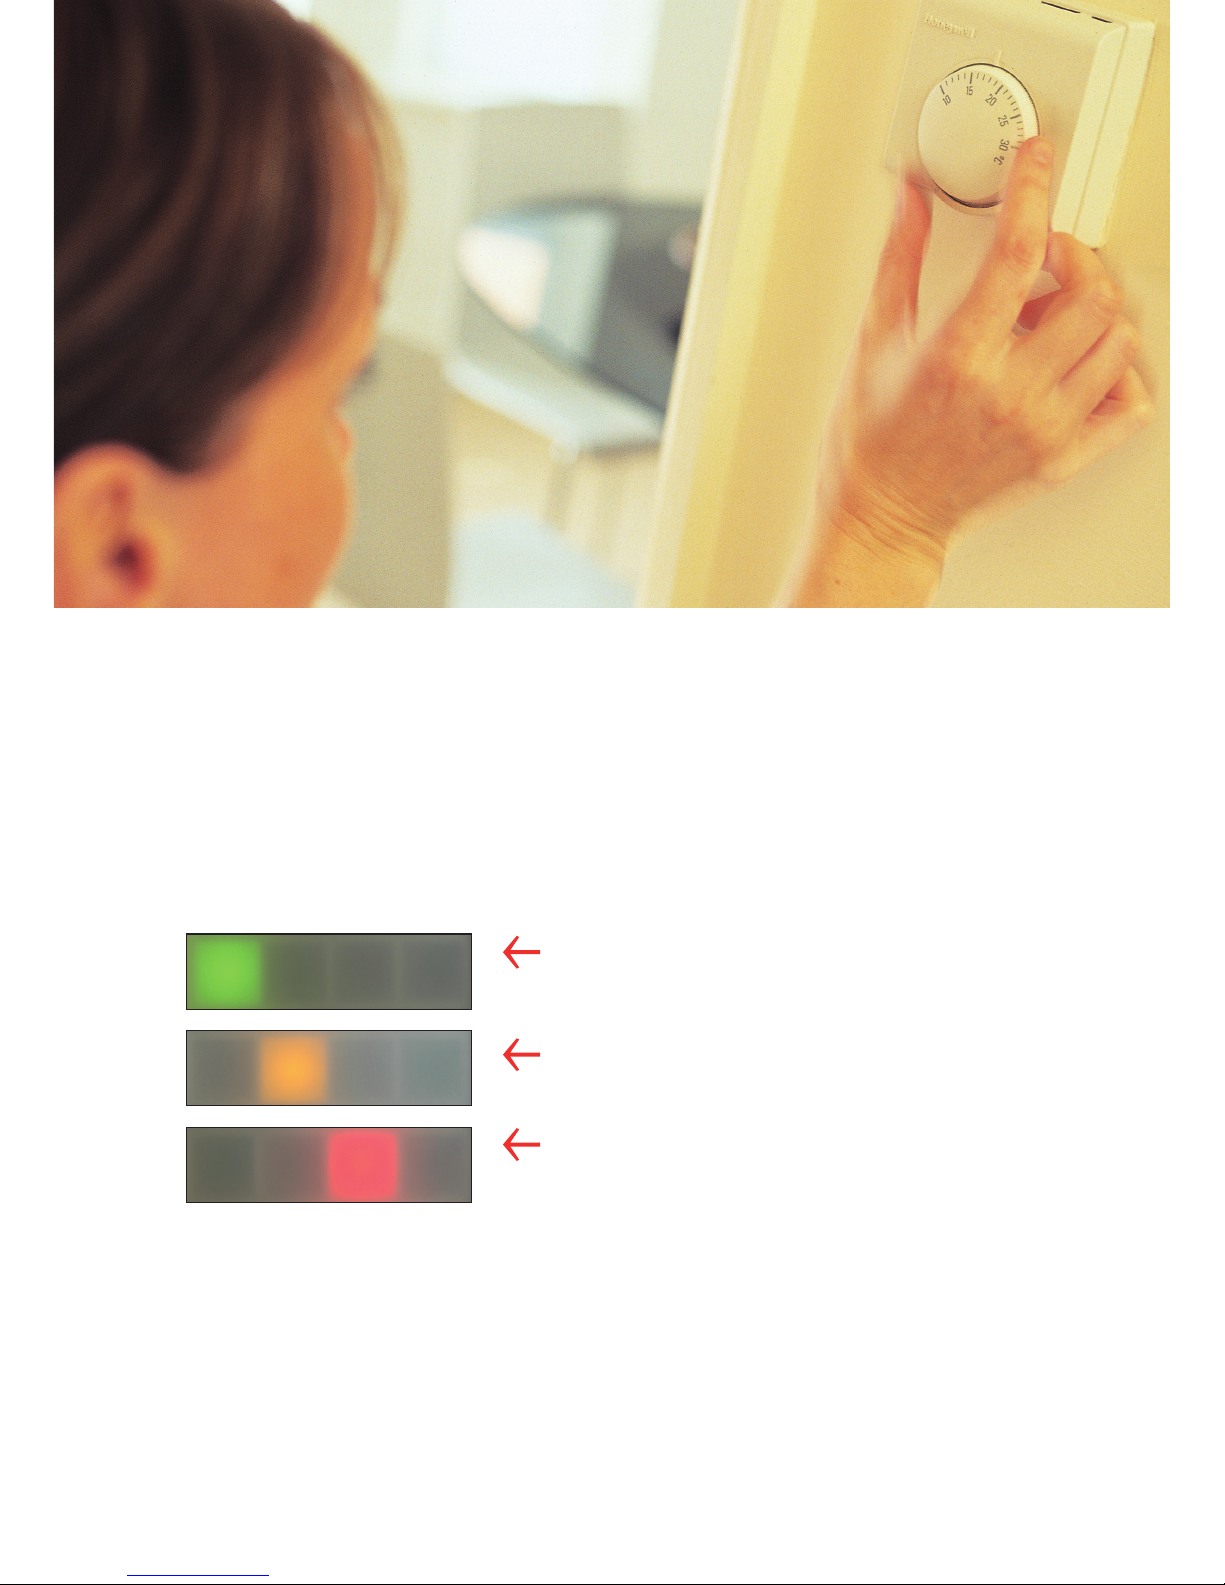
Will I see what I’m using at a glance?
Yes, your display has a traffic light system to quickly show you
how much energy you’re using in real time. The coloured lights
beneath the display screen tell you if you’re using a small,
medium or large amount of energy.
5
Green Current energy usage
is less than 150W.
Amber Current energy usage is between
150W and 1,000W (1kW).
Red Current energy usage is more
than 1,000W (1kW).
5
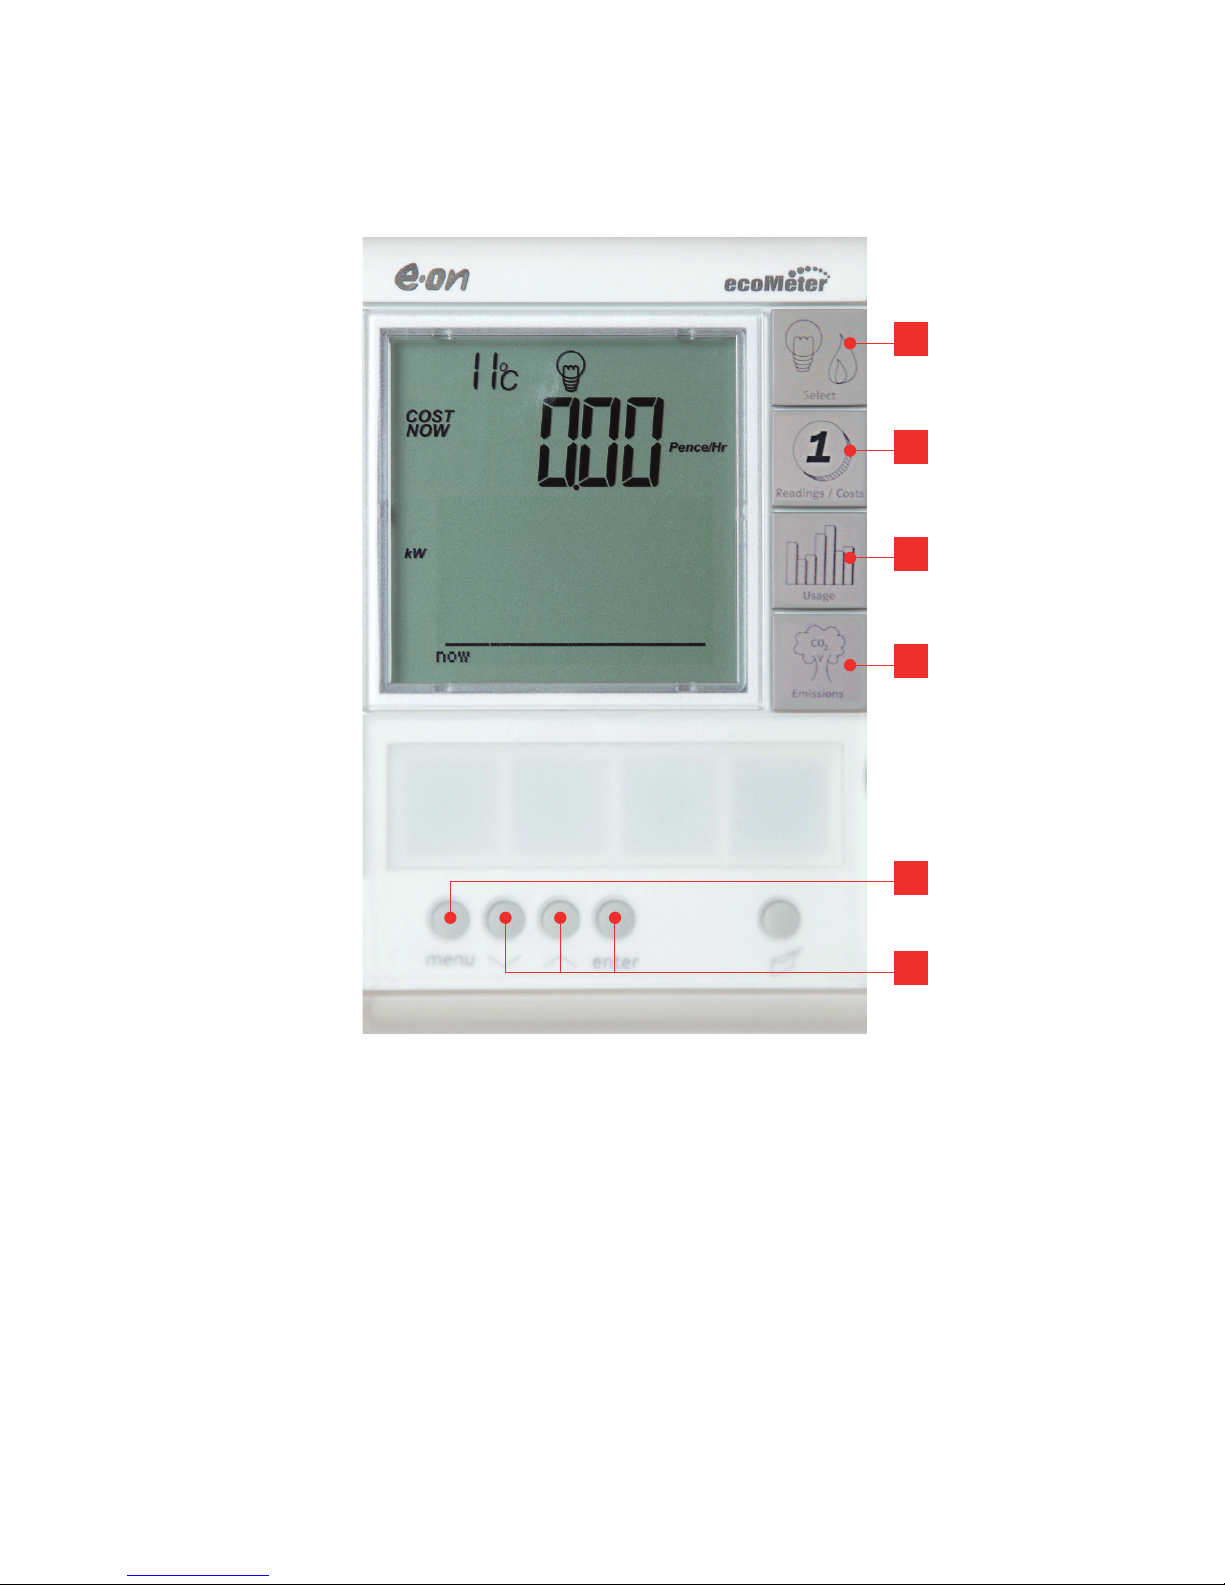
6
Your quick start guide
1
2
3
4
6
5
1. Select Fuel Button
This button will let you switch between
fuels if you have E.ON smart meters fitted
for both electricity and gas. You’ll see a
lightbulb for electricity, and a flame for gas.
On CO2 emissions, both fuels can be
shown combined.
2. Reading/Costs display
By pressing the readings/costs button you
can view the current active rate and
readings then easily move through the
screens showing a guide to all costs for
Electricity for today, yesterday, last 7
and 28 days.

7
3. Usage Display
Press this button to move through
screens showing how much you’re
currently using, and how much you’ve
used in the last 7 days, 28 days and 12
months. You can view information in
numerical and graph format.
4. Emissions Display
Press this button to move through
screens showing how much CO2 is being
produced by the energy you’re using. The
information is shown in kg of CO2 split by
selected fuel. You can view totals in real
time and for the last 7 days, 28 days and
12 months.
5. Menu
Pressing this button will display the
following menu options:
1. Set-Up Allows you to turn the key
press buzzer on or off.
2. System Info Displays your smart
meters’ serial numbers.
3. Usage Alarm Lets you set an alarm
that tells you when your electricity costs
have gone over a pre-set amount.
You can change this amount at any time,
or turn off the alarm by setting the
amount to zero. If the alarm goes off,
press any button to switch it off.
6. Menu navigation
Use the up and down buttons to scroll
through the menu options, and the enter
button to make your selections. You can
go back to the main menu by pressing
the menu button. Pressing this again
takes you out of the menu function and
back to normal operation.
Top tips
1. You can use the information shown on
the display to compare your electricity
spend across different periods helping
you budget.
2. If you’ve taken efficiency steps to help
reduce your energy consumption such as
fitting energy saving bulbs, appliances
etc, the usage screens will help you see
how much energy you’re saving.
3. Your display will show you the effects of
making even small changes to your
central heating and hot water
thermostat settings.
4. You can use the CO2 emissions
information gathered on your display to
help you make decisions about how you
could help protect the environment by
using less energy in your home.
5. If your display regularly shows a red
light, take a walk around your home and
see which appliances can be switched
off to save energy.
What are kilowatts (kW)
and kilowatt hours (kWh)?
The amounts of electricity and gas you
use are shown on your display in kilowatt
hours (kWh). Each kWh is one unit. Your
appliances all use different amounts of
energy. A typical electric kettle is rated
around 2kW, which means that, while in
use, it consumes 2kW of electricity. If the
kettle was used continuously for an hour,
it would use 2 kWh, or 2 units of electricity.
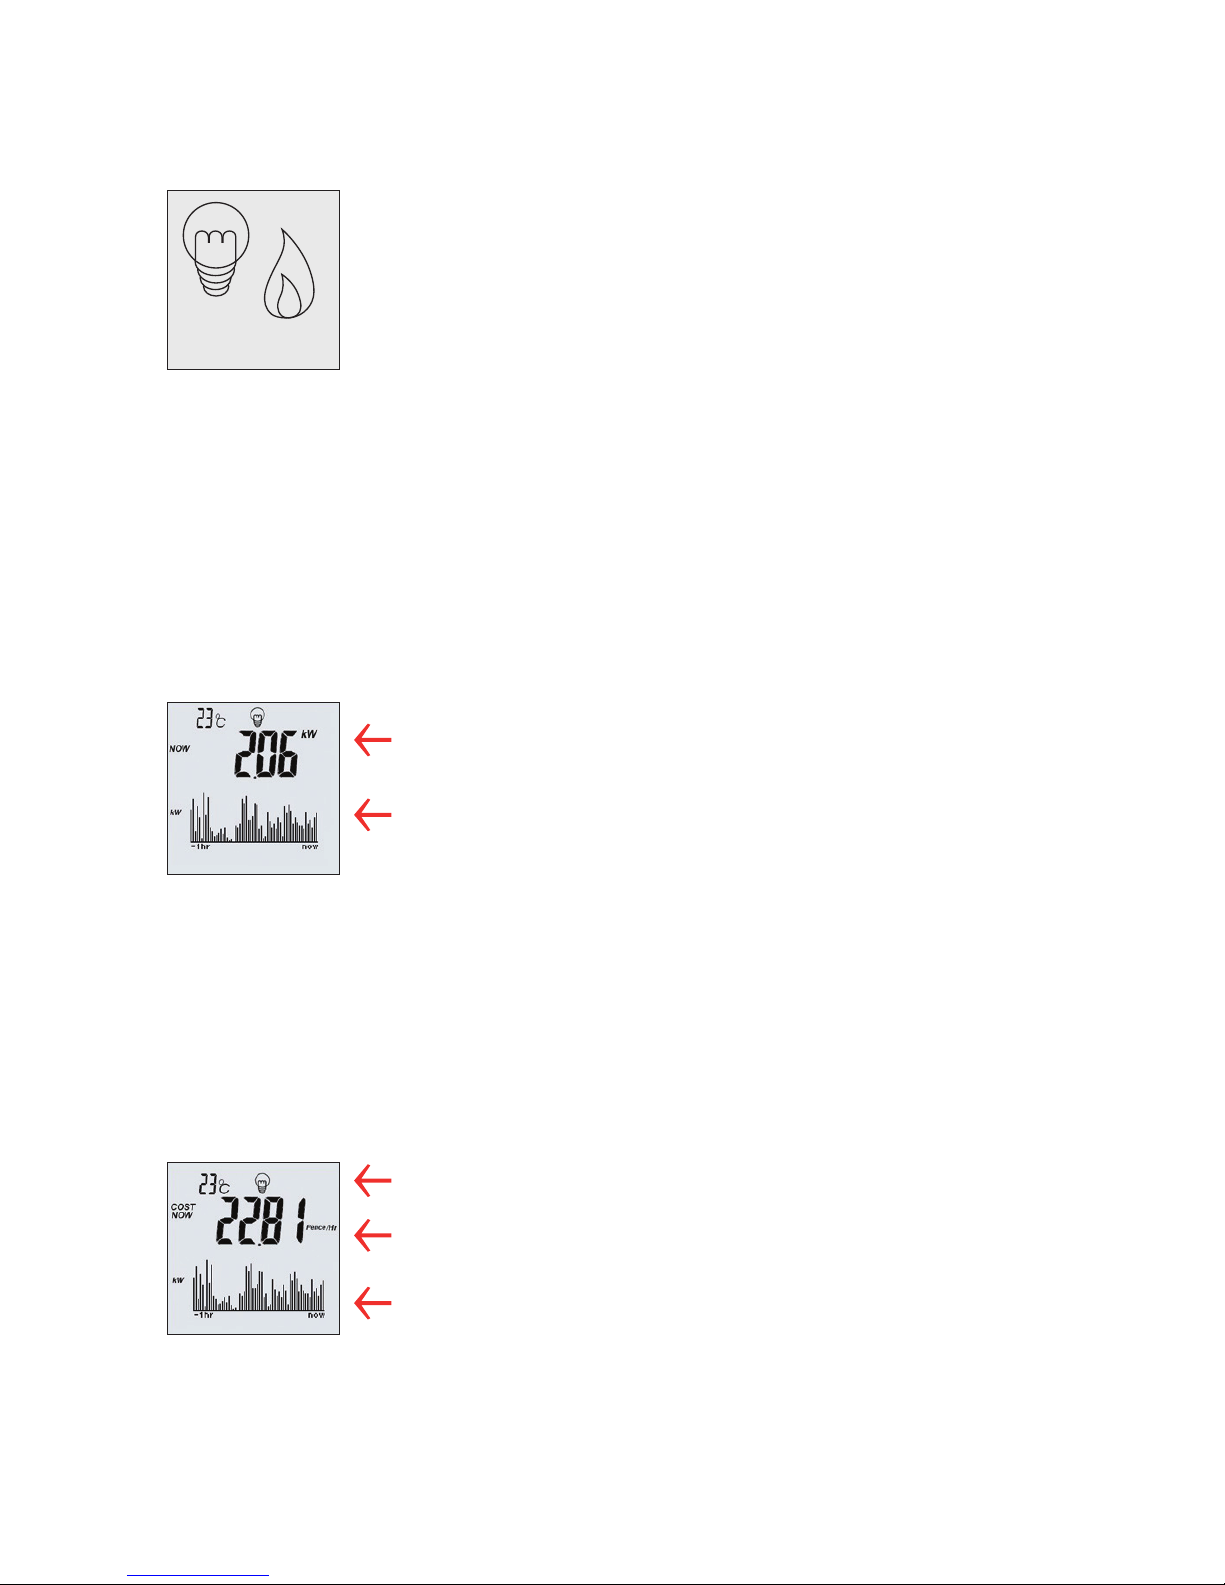
Select
This will depend on whether you have a smart meter for
electricity, gas or both.
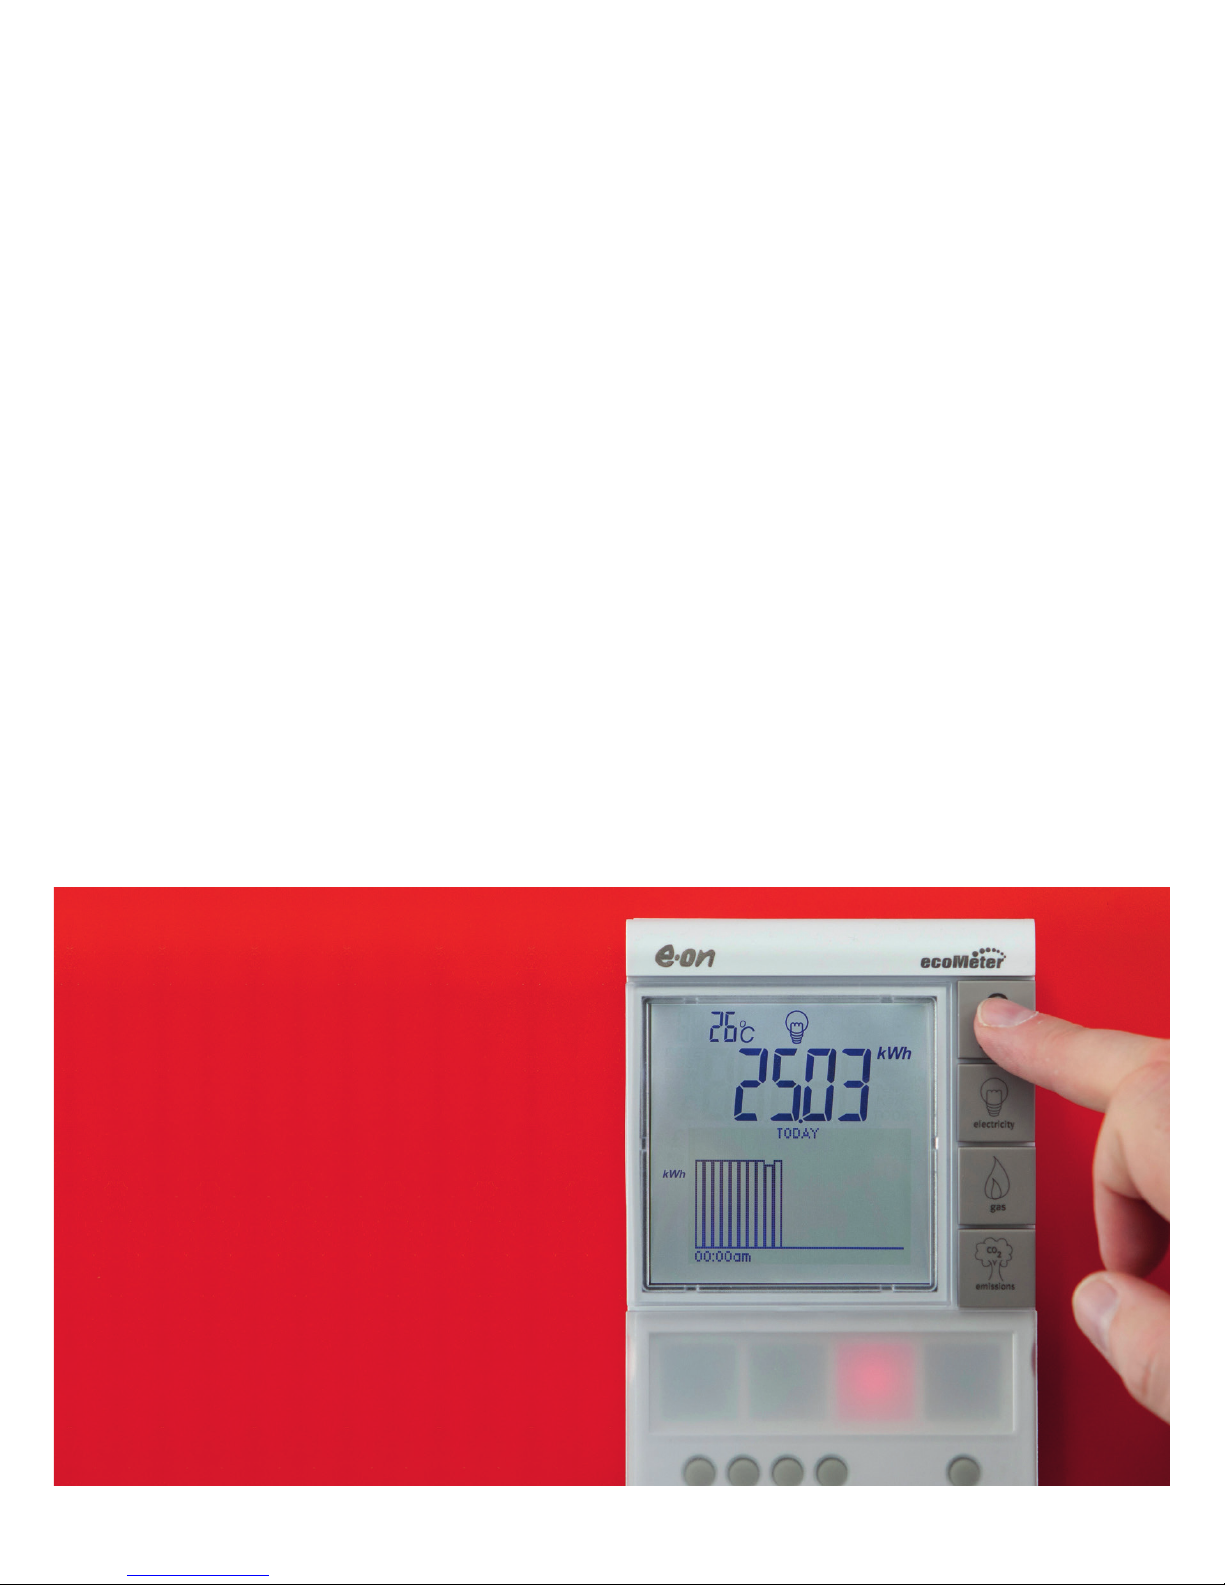
Your display will show a light bulb symbol when
presenting information about your electricity usage. It
stores the details of your electricity usage over the last 12
months and you can view this by pressing the electricity
button. Each time you press the button, you’ll move to the
next display, as shown below.
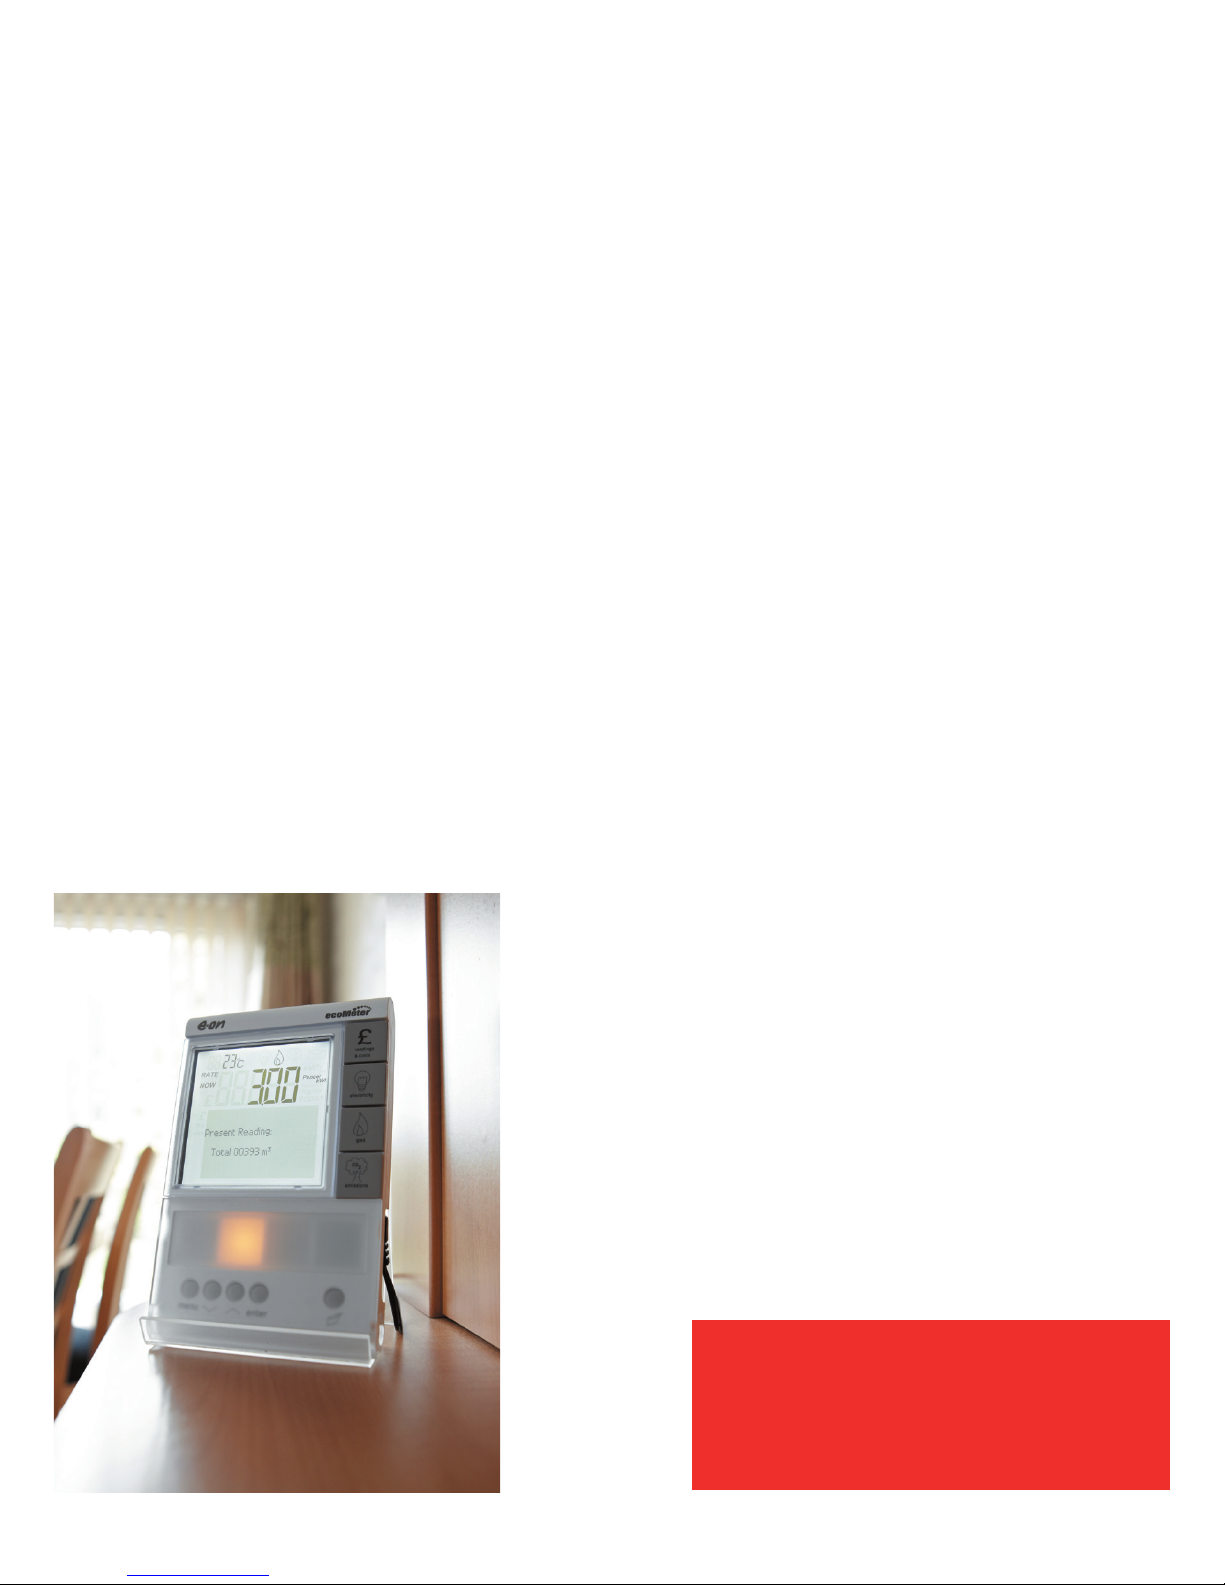
A gas flame symbol will be displayed when presenting
information about your gas usage. The first screen shows
your current usage details. Keep pressing the gas button
to view the next display, as shown in the diagrams below.
Time or temperature
How do I use this information?
Try switching appliances, such as the TV or the
kettle, on and off to see how the readings change.
You’ll get an idea of how much energy each
appliance uses, and how much it costs to run.
Cost per hour in either £/Hr or pence/Hr,
at your current rate of use
Bar graph showing the last hour’s electricity use
in kW. Each bar shows one minute of energy use
This is the default screen, press the
electricity button to return to this screen
8
Using your display
Current electricity use in kW
The values shown will change depending on
the number and type of appliances you’re using.
9
The costs on your energy display are a guide and can’t
be used to work out your bill because we use averages
to work it. Press the readings and costs button to view
details of your energy costs over different time periods,
along with corresponding meter readings. Each time
you press the readings and costs button, you’ll move
on to the next display, as shown in the diagrams below.
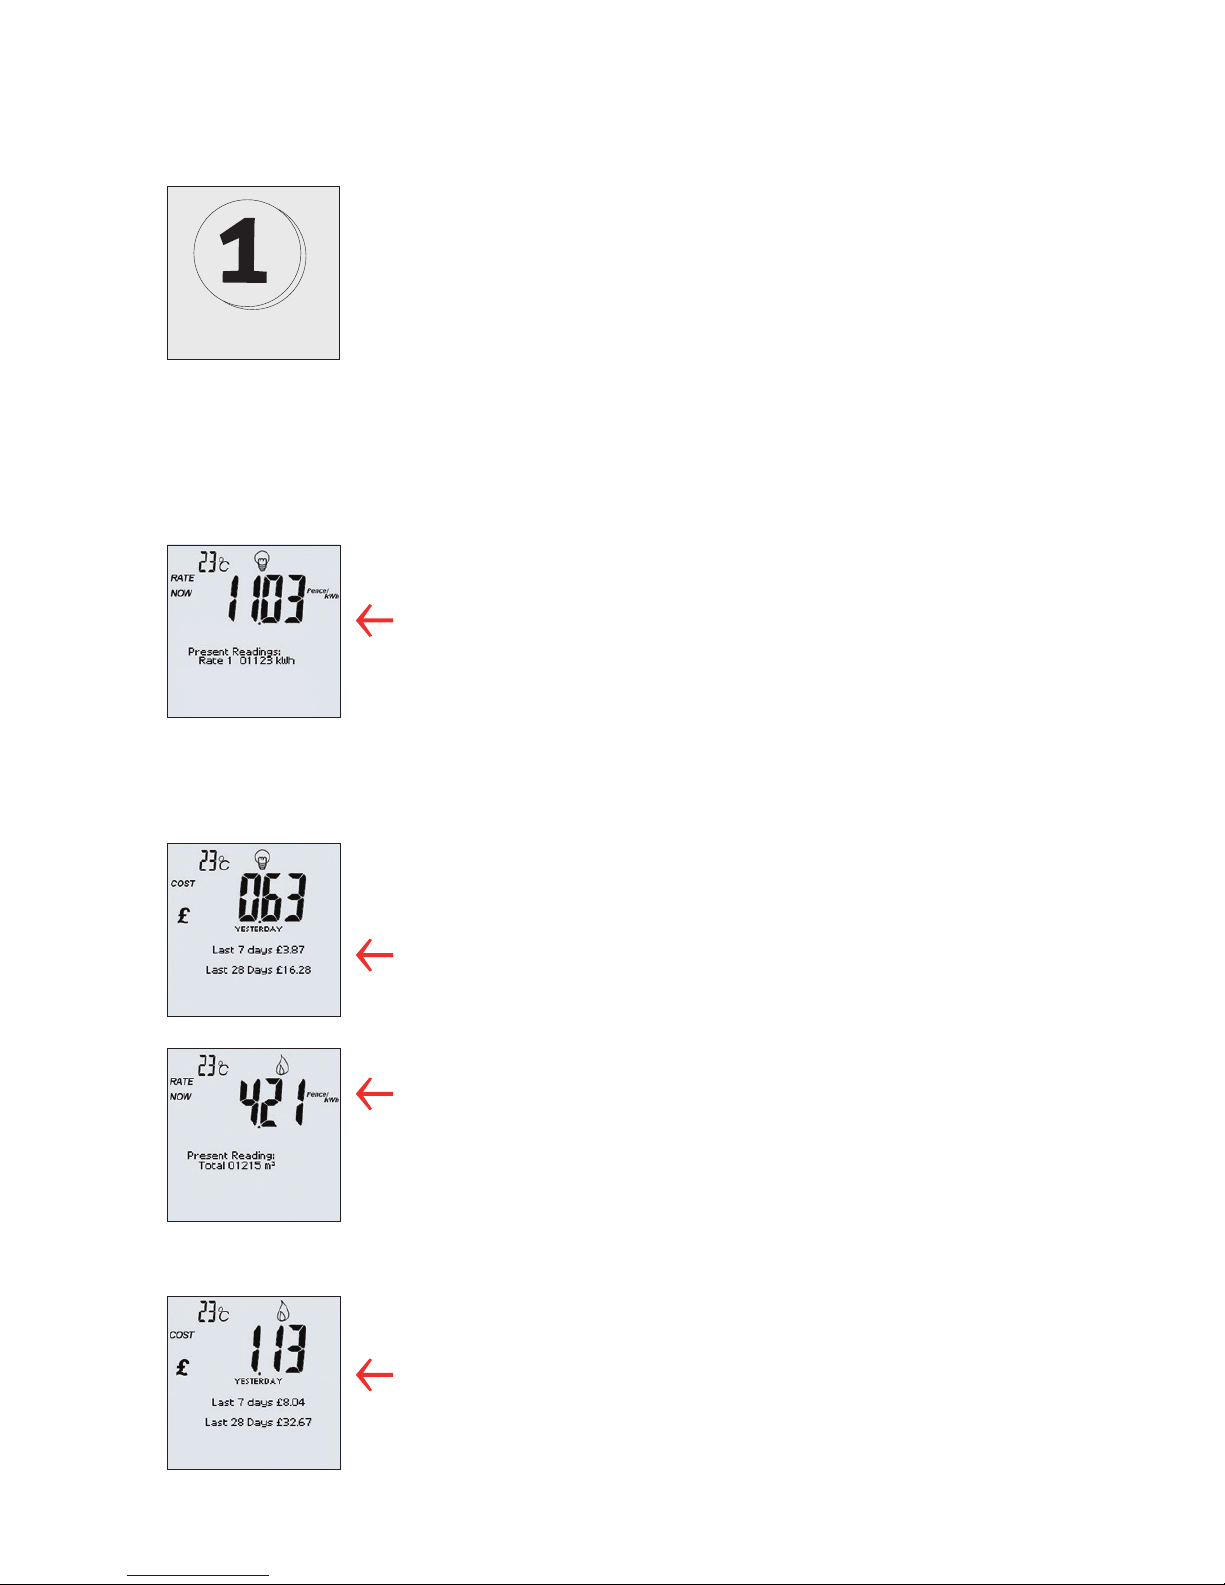
Readings/Costs
Using your display – energy costs
Electricity costs, rates
and actual meter readings
1 x button press
• Cost as pence/kWh
• Time and date
• Actual meter readings in kWh,
exactly as shown on your smart meter
and updated every 30 minutes
View your costs for electricity usage
yesterday, the last 7 days and the last
28 days
2 x button presses
Gas costs and actual meter reading
2 x button presses
• Cost as pence/kWh
• Actual meter reading in m3
, exactly
as shown on your smart meters and
updated every 30 minutes
View your costs for gas usage yesterday,
the last 7 days and the last 28 days
2 x button presses
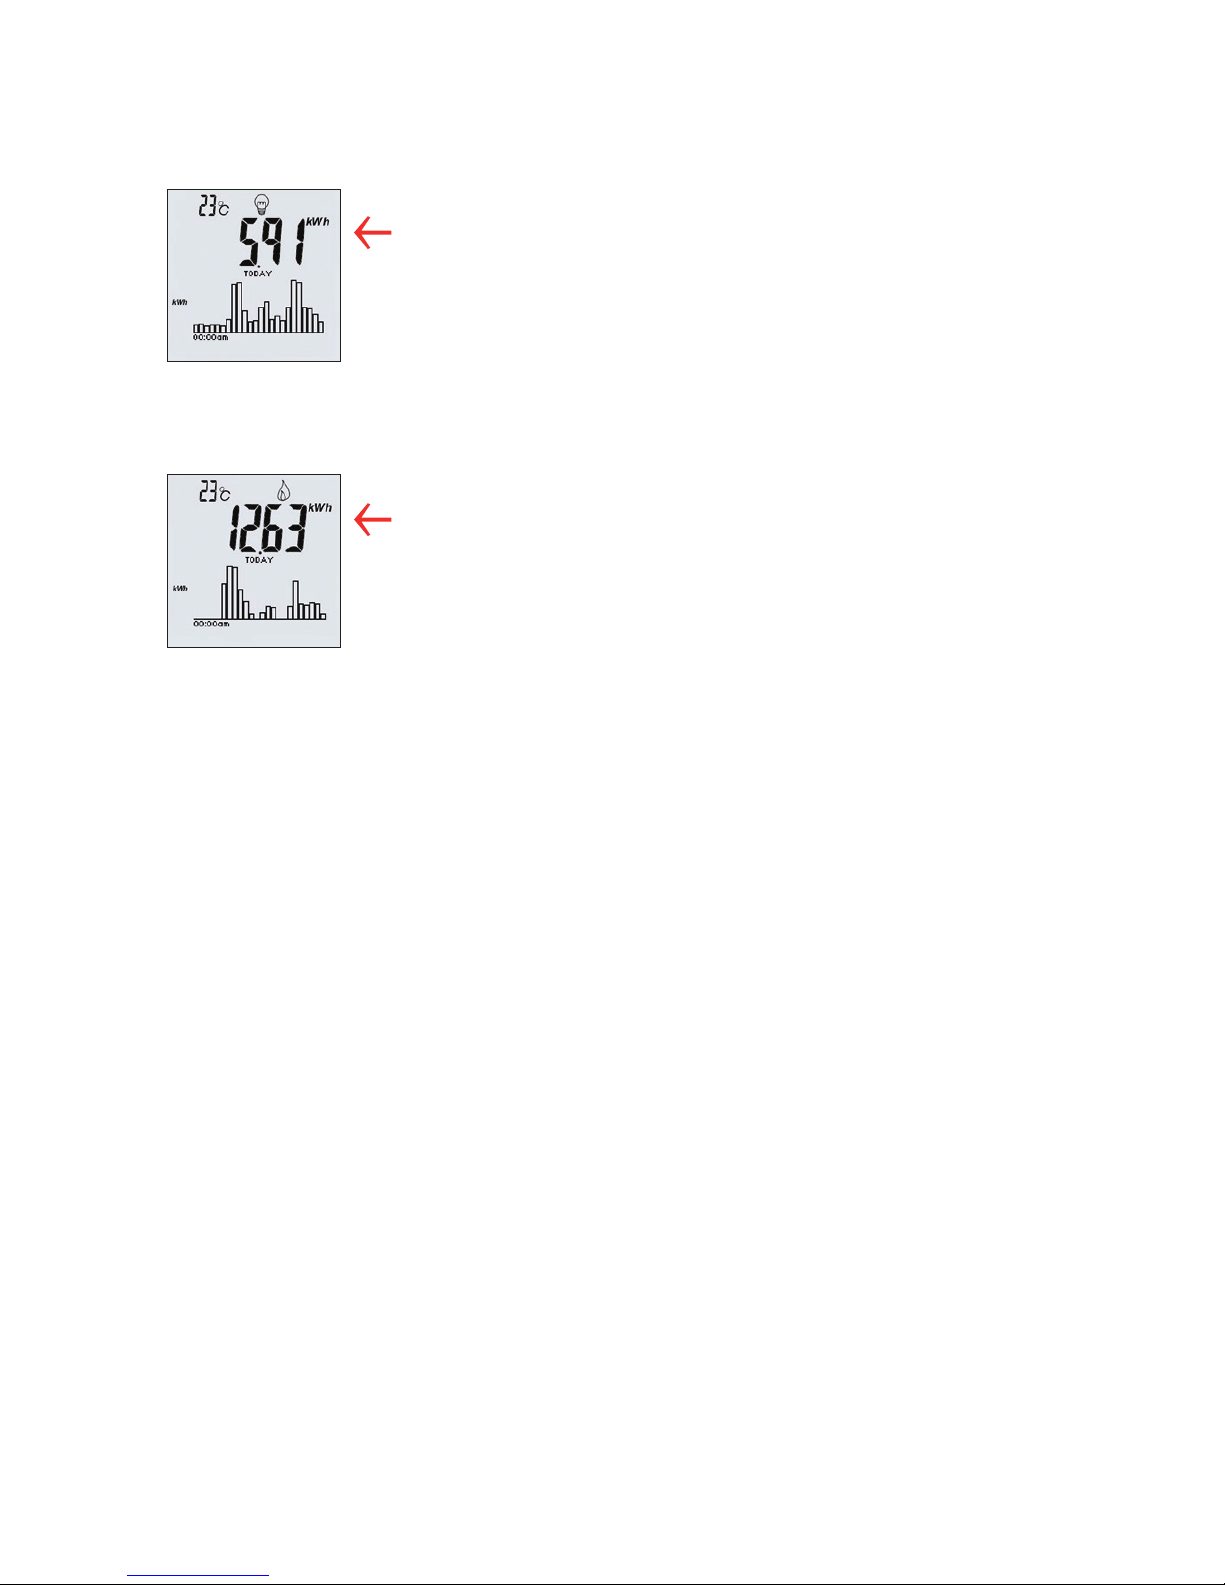
10
Electricity use
1 x button press = instant cost now and graph of today
(each bar shows 1 hour)
2 x button presses = last 7 days (each bar shows 1 day)
3 x button presses = last 28 days (each bar shows 1 week)
4 x button presses = last 12 months (each bar shows 1 month)
Using your display – usage
Gas use
1 x button press = cumulative cost and graph of today
(each bar shows 1 hour)
2 x button presses = last 7 days (each bar shows 1 day)
3 x button presses = last 28 days (each bar shows 1 week)
4 x button presses = last 12 months (each bar shows 1 month)
How do I use this information?
As well as noticing usage patterns, you’ll see how
much energy and money you’re saving if you’ve taken
energy saving steps, such as fitting loft insulation.
How is my display unit cost calculated?
Your display uses a unit cost based on averages. The
unit cost is an average of your first and next unit (as
described on your bill), and is based on Ofgems
average annual consumption figures - which are
3,300kWh for standard meters, 5000kWh for Economy
7 meters and 16,500kWh for gas.
Also if you are an Economy 7 customer your display
assumes that you use 55% of units during cheaper
times and 45% at other times. Remember, your
discounts and VAT are not included on your display.
Indice


