Motcom Data Indicator Pro Manuale utente

Data_Indicator Pro
User Manual
Part. No. 2 900 04 00000
revision 210224 english
Kurt-Schumacher-Str. 28-30
66130 Saarbrücken, Deutschland
web: www.motcomgmbh.com

Data_Indicator Pro
User manual
Revision 210224 Page 2
Contents
I. Introduction …………………………………………………………….….3
II. Installation and setup …………………………………………………...3
III. Data reading and analysing ……………….…...……………….….....4
1. Main program window………………………………………………….4
2. BeCOMS / BCom section …………………………………………....5
2.1. XY graph and options .......……………………………………5
2.2. Detailed display ...………………………...……………………7
2.3. Speed difference and thermosignal difference diagrams …8
2.4. BeCOMS / BCom section menu ..................………………..9
3. SiCOMS / OCom section ………………………...………….……..14
3.1. XY graph and options ….……………………..………...……14
3.2. Sensor Gauges and options ……………………………......16
3.3. COT temperature diagrams …………………..……………..17
3.4. SiCOMS / OCom section menu ….………………...…….....18
4. OqCOMS / OQComs section ……………….……………………....20
4.1. XY graph and options ......……………………………………20
4.2. Sensor Gauges and options ……………………………......23
5. Modbus TCP menu ……………….……………………..................24

Data_Indicator Pro
User manual
Revision 210224 Page 3
I. Introduction
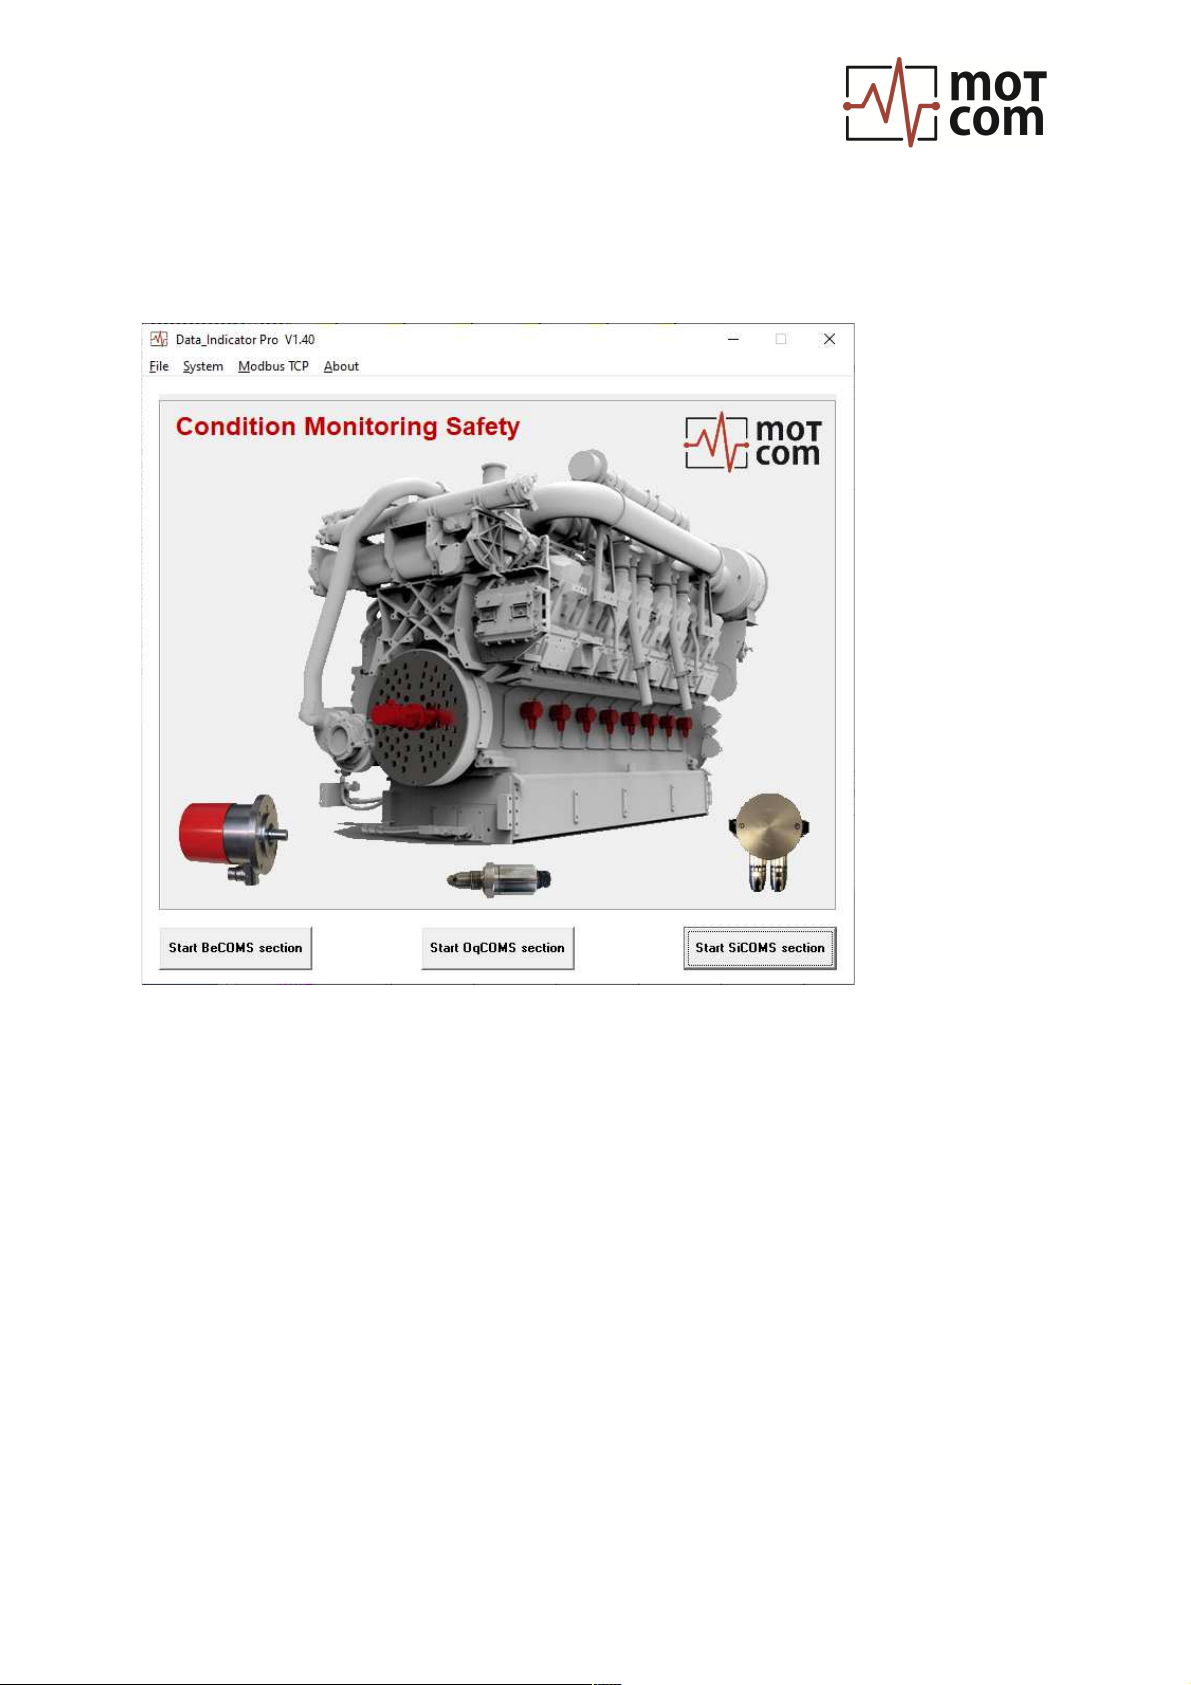
Data_Indicator Pro is a PC application used in the BeCOMS / BCom, SiCOMS /
OCom and OqCOMS systems for displaying and analysing corresponding recorded
log files.
As described in respective User Manuals ???, the local control device, Evaluator,
provides instant information on several important engine condition parameters.
BeCOMS / BCom Data Logger program constantly monitors and displays bearing
condition related data; SiCOMS / OCom Data Logger works with information for oil
mist detection, and OqCOMS Logger processes data on oil quality. All these
programs record the monitoring data into log files.
Any of the BeCOMS, SiCOMS and OqCOMS system If measured values indicate a
dangerous situation for the engine, it can be stopped through an alarm system or
manually to avoid serious damages. At the same time, review and analysis of
recorded log data give more detailed view on engine health.
II. Installation and setup
In order to install Data_Indicator on a computer with Windows operating system,
double-click at setup.exe on a provided installation CD or other media. Follow the
instructions in the setup program.
After the installation is finished, Data_Indicator can be started through a program
group in Windows Start menu (“n.nn” is a placeholder for version number):
System requirements:
• Intel Core2Duo processor 2.66 GHz or higher
• CD-Rom drive, recommended CD-R/W drive
• min. 4 GB RAM
• hard disk with capacity of min. 160 GB
• supports Windows XP, Windows Vista, Windows 7, Windows 8.x, Windows 10

Data_Indicator Pro
User manual
Revision 210224 Page 4
III. Data reading and analysing
1. Main program window
Fig. III-1. Main program window
The main window of Data_Indicator Pro is a start point for selecting the type of logfile
to analyse. It also gives access to some Data_Indicator system settings.
Start BeCOMS section: open analysis window for BeCOMS / BCom logfiles
(alternatively: menu “File / Start BeCOMS section”)
Start OqCOMS section: open a OqCOMS logfile analysis window
(alternative: menu “File / Start OqCOMS section”)
Start SiCOMS section: open a SiComs / OCom logfile analysis window
(alternatively menu “File / Start SiCOMS section”)
The “System” menu offers commands to register xlg-, slg- or qlg-logfiles to be
opened in Windows Explorer with Data_Indicator by default, or to delete the
registration.
The “Modbus TCP” menu is described in section 5 of this manual.

Data_Indicator Pro
User manual
Revision 210224 Page 5
2. BeCOMS / BCom section
The BeCOMS section of Data_Indicator displays an empty graph after start. Use “File
/ Load BeCOMS/BCom logfile” menu (see III, 2.4.1) to open a BeCOMS log file.
Reading a large log file can take up to a couple of minutes. The data is added
incrementally to the graph and the amount of read data in per cents is displayed at
the bottom left corner of the main panel:
Fig. III-2. loading a BeCOMS / BCom log file
2.1. XY graph and options:
a
The graph displays thermo voltage and engine rotation speed data:
Tsignal % alarm : Thermo voltage in percents relative to preset alarm level
Speed RPM /10 : Engine rotation speed in RPM divided by 10
Tvoltage mV x50 : Absolute thermo voltage in mV multiplied by 50
Teff DC % alarm : Effective value of thermo voltage in percents of DC alarm level
Teff AC % alarm : Effective value of thermo voltage in percents of AC alarm level
Initially loaded, the data is scaled down so that the chart X-axis displays 24-hour
interval starting from the first time stamp in the log file.
The graph has a set of options to navigate through the data and see detailed
information at a certain time point (Fig. III-3).
b
a
d
c

Data_Indicator Pro
User manual
Revision 210224 Page 6
Double-click on the graph to switch on/off its Mode menu with options.
Click an option to change the navigation mode of the graph:
Scroll-X (Scroll-Y):
scroll the graph along X- or Y-axis
Scroll-XY:
scroll along both X- and Y-axis
To scroll, hold the left mouse button and move the mouse to the desired direction.
Zoom-X (Zoom-Y):
enlarge/shrink the graph along X- or Y-axis
Zoom-XY:
enlarge/shrink along both X- and Y-axis
To zoom, hold the left mouse button and move the mouse to the right to enlarge and
to the left to shrink the graph in X-axis direction. Or, move the mouse upwards to
enlarge and downwards to shrink along Y-axis.
Zoom-Box:
enlarge selected area of the graph. Hold the left mouse
button and move the mouse to select an area. Releasing
the mouse button stretches the selection to the frame of
the graph.
Cursor:
display the X and Y values of the selected plot point and
open three additional windows: Detailed Display,
Thermosignal difference diagram, and Speed difference
diagram (see III, 2.1, 2.2, 2.3).
Fig. III-3. BeCOMS / BCom window, time scale (X-axis) enlarged, chart in Cursor mode
Plot:
return the graph to its default scale.

Data_Indicator Pro
User manual
Revision 210224 Page 7
Channels (displayed parameters):
b
Tsignal % alarm : display / hide thermo voltage signal in per cents at the graph
Speed RPM / 10 : display / hide rotation speed signal
Tvoltage mV x50 : display / hide absolute thermo voltage values (in mV)
Teff DC %alarm : display / hide effective thermo voltage in % of DC alarm level
Teff AC %alarm : display / hide effective thermo voltage in % of AC alarm level
Select time:
c
Allows to select a time point from the log file. Measurement data recorded at this
point will be displayed in detailed display window, speed difference diagram and
thermosignal difference diagram windows.
Event log window:
d
Displays event messages and warnings recorded in the BeCOMS / BCom data log
file. Double-click anywhere at its field to open a larger window with event log (“Status
window”).
2.2. Detailed Display
Fig. III-4. Detailed Display
This window is opened on “Cursor” command of XY graph options menu. It contains
a polar diagram which plots thermo voltage and crankshaft angle acceleration in
polar coordinates during the full combustion cycle nearest to the time point selected
at the XY graph (chapter III, 2). At the right side there’s an XY diagram of the polar
data with X axis representing the rotation angle.

Data_Indicator Pro
User manual
Revision 210224 Page 8
2.3. Speed difference and thermosignal difference diagrams
Speed difference diagram
Fig. III-5. Speed difference diagram
The diagram shows absolute cylinder speed (blue bars) and the difference between
engine cylinder speed (pink bars) relative to the cylinder average speed during the
nearest full combustion cycle.
Thermosignal difference diagram
Fig. III-6. Thermosignal difference diagram
The red bars at the thermosignal difference diagram represent thermo signal in per
cents of alarm level during the nearest full combustion cycle. The pink bars show this
value relatively to the engine cylinder average thermosignal.

Data_Indicator Pro
User manual
Revision 210224 Page 9
2.4. BeCOMS / BCom section menu
Before a logfile loaded, the main menu for BeCOMS / BCom window has four items:
While loading a logfile, the menu is extended, and gets a “Cancel” command to stop
loading a file:
After BeCOMS data file is loaded, the “Cancel” command is removed:
2.4.1. File menu
Fig. III-7. File menu
File / Load BeCOMS/BCom logfile:
Select a BeCOMS file in a standard Windows Open dialog:
Fig. III-8. “Open” dialog

Data_Indicator Pro
User manual
Revision 210224 Page 10
File / Print XY graph: print the current view of the XY graph using standard
Windows Print dialog.
File / Snapshot XY graph: create a JPG image out of the current XY graph view.
Type a file name for the JPG image in the standard Windows “Save As” dialog, then
press “Save”.
Fig. III-9. “Save As” dialog for menu File / Snapshot
Indice
Altri manuali Motcom Strumento di misura


